Source: Hertzsprung and Russell, Museum of Flight
Not all stars are the same nor are they in the same stage in their life cycle.
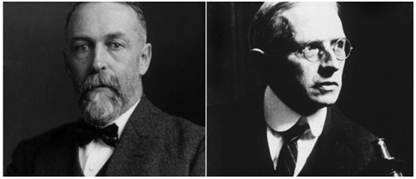
In 1911, Ejnar Hertzsprung, a Danish astronomer, used a graph to compare the temperature and brightness of stars. Two years later, Henry Norris Russell, an American astronomer, made similar graphs using slightly different data. The combination of their ideas is now called the Hertzsprung-Russell diagram (or H-R diagram). The Hertzsprung-Russell diagram (or H-R diagram) is a graph that shows the relationship between a star’s surface temperature and brightness. (Brightness is displayed as absolute magnitude or luminosity.)
Source: Hertzsprung and Russell, Museum of Flight
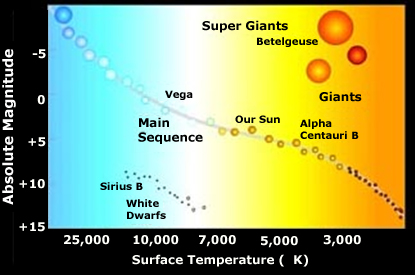
The H-R diagram is also a tool for studying the nature of stars and how they change over time. Below is an example of an H-R diagram.
Source: H-R Diagram, Aspire
How do you read the H-R Diagram?
ASPIRE Astrophysics Science Project
- In the Hertzsprung-Russell Diagram, each star is represented by a dot. The position of each dot on the diagram tells us two things about each star: its luminosity (or absolute magnitude) and its temperature.
- The vertical (up and down) axis represents the star’s luminosity or absolute magnitude. Luminosity is how bright or how dim the star appears. Depending upon the chart you use, the labels on the H-R diagram could be a little different. Luminosity is a common term, as is absolute magnitude which you learned about in section three.
- The horizontal axis represents the star’s surface temperature and usually this is labeled using the Kelvin temperature scale. Notice the scale is also backwards from other graphs. The higher (hotter) temperatures are on the left, and the lower (cooler) temperatures are on the right. Some H-R diagrams include the color of stars, which you learned about in section three.

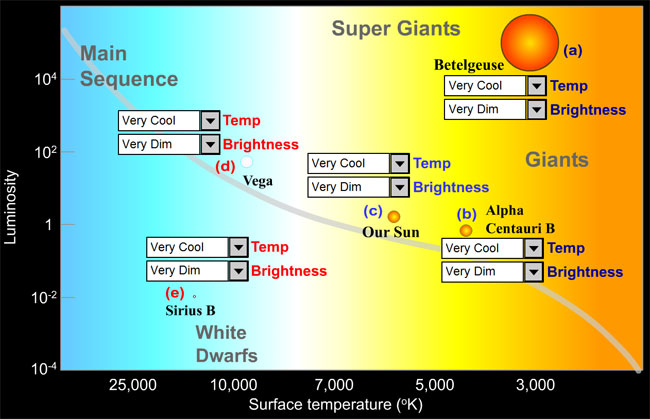
 Let’s see how well you can read the H-R diagram in this interactive. Click on the image below to access the interactive.
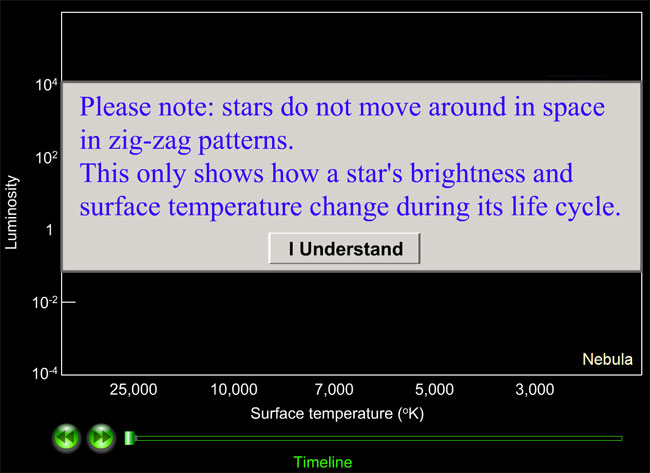
How does a star change through its life time? This animation will show you. (In the animation, a star will move through the diagram. Note: in real life a star does not physically move around as it ages.) The animation shows you how its brightness and surface temperature changes over time. Click the forward button in the animation to see the life cycle of the star. Click on the image below to access the animation.