I immediately dislike the labels on the axes. It appears they are not equally spaced, 4, 8, 13, 17, …
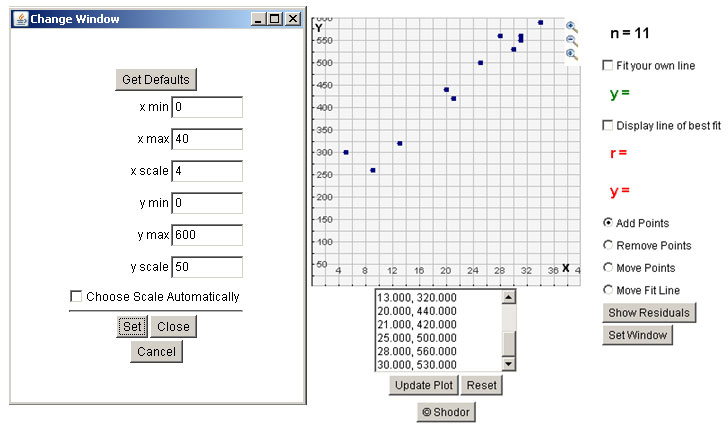
Click on Set Window.
You can set the window in many correct ways. This is how I did mine.
From the graph we can determine if a set of data has a positive, negative, or no correlation. A positive correlation means the points are increasing on the graph. A negative correlation means the points are decreasing. No correlation means the points are scattered and do not have any type of pattern.
Looking at the points above, does this data have a positive, negative, or no correlation?
