The following link will launch a video in a new window/tab, which will show how to graph a hyperbola. When you are finished watching the video, close the window/tab to return to this lesson.

Video segment. Assistance may be required. Graphing the Equation of a Hyperbola

The steps to graphing a hyperbola are a little different from graphing a circle or an ellipse:

Using this equation of a hyperbola as our example, follow the steps:
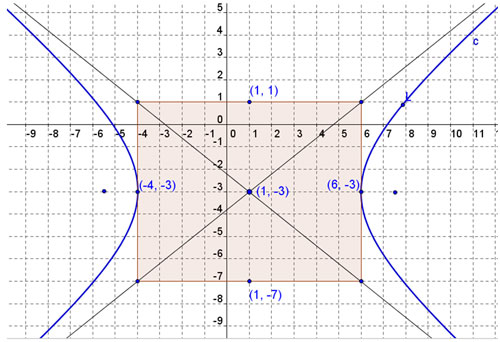
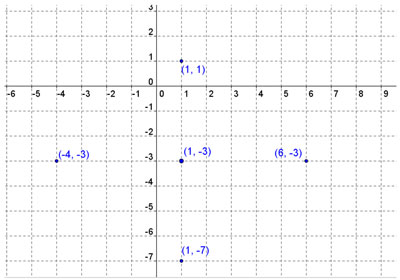
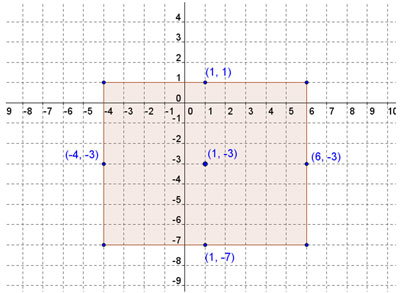
x minus one squared over 25 (x1)2 25 y plus three squared over sixteen (y + 3)2 16 = 1

  1. Find the coordinates of the center point (h, k) and plot.

    Interactive popup. Assistance may be required.

    Check Your Answer

    h = 1 and k = -3, so center point is (1, -3)
    Close Pop Up

    graph of point (1,-3)

  2. Determine the length of the major axis and the minor axis by taking the square root of the numbers in the denominators of each term in the equation.

    Interactive popup. Assistance may be required.

    Check Your Answer

    major axis = √25 and minor axis = √16 = 4 Close Pop Up
  3. Determine the direction the hyperbola opens based on which term is positive.

    Interactive popup. Assistance may be required.

    Check Your Answer

    Hyperbola opens in the x-direction (horizontally or side-to-side) since the x term is positive while the y term is negative. Close Pop Up
  4. Mark points along the horizontal (major axis) and vertical (minor axis) lines through the center point that are the indicated radial distance from the center in each direction.

    Interactive popup. Assistance may be required.

    Check Your Answer

    Points on horizontal will be (6, -3), 5 units to the right of the center, and (-4, -3), 5 units to the left of the center. Points on the vertical will be (1, 1), 4 units up from center, and (1, -7), 4 units down from center.
    Close Pop Up

graph of points (1,1), (-4,3), (1,-3), (6,-3) and (1,-7)

Sketch a rectangle, including each of the previously plotted points at the centers of each of the sides of the rectangle.

Vertices of the rectangle will be the intersections of the vertical and horizontal lines through the plotted points.

graph of points (1,1), (-4,3), (1,-3), (6,-3) and (1,-7) showing a rectangle with corner points (-4,1), (6,1), (6,-7) and (-4,-7) shaded

Draw in the asymptotes through the diagonals of the rectangle.

What are the slopes of the asymptotes?

Interactive popup. Assistance may be required.

Check Your Answer

4 over 5 4 5 (± the y-radius over the x-radius)
Close Pop Up

graph of points (1,1), (-4,3), (1,-3), (6,-3) and (1,-7) with a rectangle with corner points (-4,1), (6,1), (6,-7) and (-4,-7) shaded with a straight line drawn through (-4,1) and (6,-7) and another straight line drawn through (6,1) and (-4,-7)

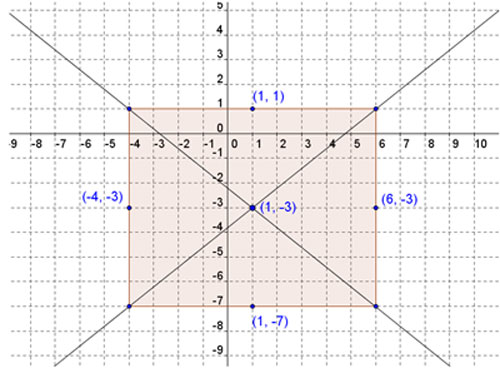
The points on the rectangle through the major axis are the vertices of the curves of the hyperbola. (in this case, (-4, -3) and (6, -3). Sketch the curves from the vertices and approaching the asymptotes.

graph of points (1,1), (-4,3), (1,-3), (6,-3) and (1,-7) with a rectangle with corner points (-4,1), (6,1), (6,-7) and (-4,-7) shaded with a straight line drawn through (-4,1) and (6,-7) and another straight line drawn through (6,1) and (-4,-7) and a hyperbola touching (-4,-3) and (6,-3)