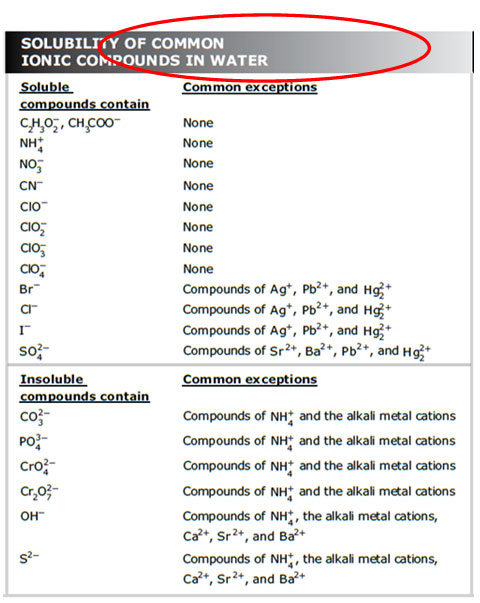
The chart shown below is from the Chemistry STAAR resource materials. It is one way to represent the solubility of common ions. Remember, these are only for compounds dissolved in water. If the solvent was changed, so were all the rules.
Think back to the lab you saw in the video in the previous section. Compare your results to the predicted solubility of compounds in this chart.
For example, all NH4+ ions were soluble. What does the chart say about the solubility of NH4+ ions?
Let’s try one more example. Ag2CO3 formed an insoluble compound, but (NH4)2CO3 was soluble. Does the solubility chart accurately predict those results?
As you read the chart, remember the following:
 Now it is your turn to practice using the solubility chart on your own.