| x | y |
|---|---|
| -8 | 7 |
| -4 | 6 |
| 0 | 5 |
| 4 | 4 |
| 8 | 3 |

| x | y |
|---|---|
| -4 | -8 |
| -2 | -5 |
| 0 | -2 |
| 2 | 1 |
| 4 | 4 |
| x | y |
|---|---|
| -2 | -19 |
| -1 | -14 |
| 0 | -9 |
| 1 | -4 |
| 2 | 1 |
Slopes can also be found in a table by looking for the rate of change (also known as the slope).
Let’s look at some table data.
| x | y |
|---|---|
| -2 | -4 |
| -1 | -1 |
| 0 | 2 |
| 1 | 5 |
| 2 | 8 |
We can see that the values in the x column and the values in the y column make ordered pairs, which could be plotted on the graph or used in the formula.
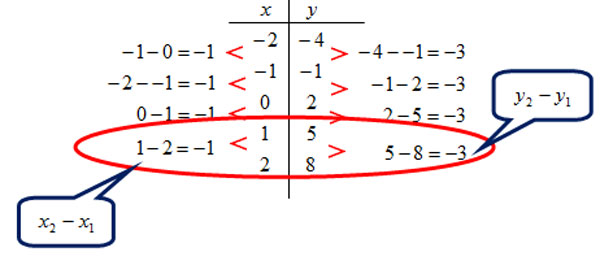
Another way is to find the differences between each value by subtracting and recording the information along the sides of the table.
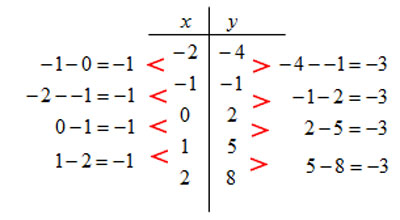
We can see that the difference in the x-values is constantly -1, and the difference in the y-values is -3 . Since there is a constant difference, we can find the rate of change or slope by creating the ratio negative three over negative one -3 -1 = 3.
This process really is just a different version of using the slope formula. If we pick any two ordered pairs, we can use the difference of the y-values and the difference of the x-values. In the end, we just created a ratio with the results.
Practice finding the slopes from the following data tables.
| x | y |
|---|---|
| -8 | 7 |
| -4 | 6 |
| 0 | 5 |
| 4 | 4 |
| 8 | 3 |
| x | y |
|---|---|
| -4 | -8 |
| -2 | -5 |
| 0 | -2 |
| 2 | 1 |
| 4 | 4 |
| x | y |
|---|---|
| -2 | -19 |
| -1 | -14 |
| 0 | -9 |
| 1 | -4 |
| 2 | 1 |
So, now we have three distinct ways of finding the slope of a line: table, graph, and formula.
Another way of finding the slope of a line is algebraically. Put the equation in slope-intercept form, y = mx + b , to find the value of m, the slope.
Bob's savings account activity over the last year is charted in the graph below.
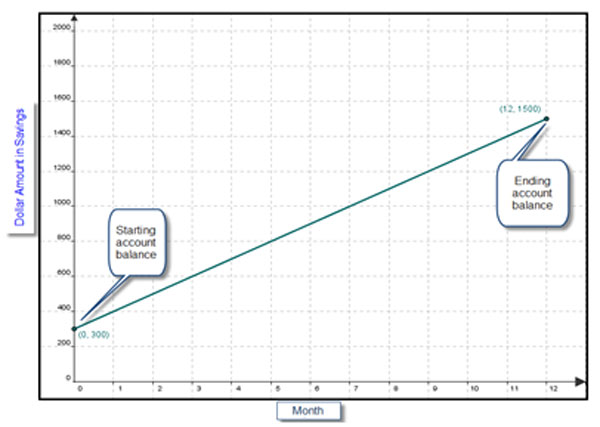
Use the information provided in the graph to help Bob determine how much he saved per month over a year.
In 1998, Keith bought a small house with 2 acres for $144,000. In 2009, the value of the house rose to $245,000. Find the average annual rate of inflation in dollars of Keith's house.

Source: Our House Near to Littlemore, Oxfordshire, Great Britain, Photographer 2202, Geograph
Jose, Carlos, and Manuel's parents have been measuring their height every year since they were 3 years old. Determine their growth rate base on the information in the table below.
Height in Inches |
|||
| Jose | Carlos | Manuel | |
| 3 years old | 41 | 46 | 45.5 |
| 4 years old | 43 | 48.5 | 47.75 |
| 5 years old | 45 | 51 | 50 |
| 6 years old | 47 | 53.5 | 52.25 |
| 7 years old | 49 | 56 | 54.5 |
Click on the blank to check your answer.
Jose's growth rate Interactive button. Assistance may be required.
_______
is 2 inches per year.
Carlos's growth rate Interactive button. Assistance may be required.
_______
is 2.5 inches per year.
Manuel's growth rate Interactive button. Assistance may be required.
_______
is 2.25 inches per year.
If this rate continues until they are 14 years old, how tall will they be?
Jose's approximate height at 14 Interactive button. Assistance may be required. _______ will be 63 inches .
Carlos' approximate height at 14 Interactive button. Assistance may be required. _______ will be 71 inches .
Manuel's approximate height at 14 Interactive button. Assistance may be required. _______ will be 68 inches.