Time (Days) |
Plant Height (cm) |
1 |
0 |
2 |
2 |
3 |
4 |
4 |
6 |
5 |
8 |
6 |
10 |
A graph can be thought of as a "picture" of data. Graphs are useful because they can reveal patterns or trends and can be used to make predictions. You can analyze and evaluate data found in graphs to make predictions.
Let's look at an example of using data to reveal patterns or trends and make predictions.
A student conducted an experiment to determine if the temperature of the water affected the breathing rate of the freshwater sunfish. Temperature was measured in degrees Celsius and breathing rate was per minute. The data table and graph below show the data that was collected. Notice some of the data in the data table is missing.

You Try!
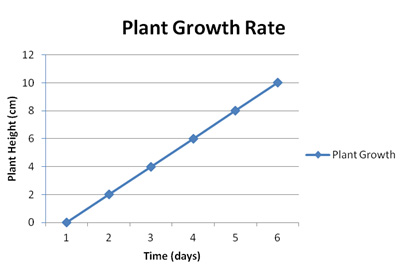
Time (Days) |
Plant Height (cm) |
1 |
0 |
2 |
2 |
3 |
4 |
4 |
6 |
5 |
8 |
6 |
10 |
A student was studying the use of fertilizers to promote plant growth in the laboratory. This graph shows her data on one plant. Analyze the data provided in the graph to answer the following questions.
What was the height of the plant at day 5?
Using the data provided in the graph, what would you predict the plant height to be on day 7?
Using the data provided in the graph, what would you predict the plant height to be on day 12?