 Click on the words below.
In this section, we are going to look at velocity vs. time graphs. Remember that velocity is the speed and direction an object is moving. In this lesson, we're only going to talk about objects moving in one direction, so only the speed of the object will be changing.
Velocity vs. time graphs look much like position vs. time graphs. You have to look very carefully at the axes. Be sure and read the axes labels!
Click on the words below.
Let's look at some velocity vs. time data to see how it is displayed on a velocity vs. time graph.
A car's velocity increases until it reaches a velocity of 15 km/hr, and then it travels at a constant velocity at a rate of 15 km per hour for 5 hours.
When a car's velocity increases, it is accelerating. The data below shows a car accelerating during the first seconds of motion.
Click in the data table to see the remaining data. Pay close attention to what is happening in the graph as well. Notice that the units on this graph are meters and hours.
When an object decreases in velocity, it is decelerating. The data below shows a car decelerating and coming to a complete stop.
Click in the data table to see the remaining data. Pay close attention to what is happening in the graph as well. Notice that the units on this graph are meters and hours.
The graph below shows two objects accelerating at different rates.
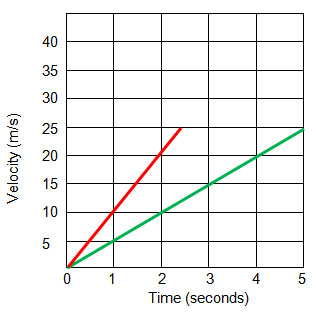
Both lines show increasing velocity, and both lines reach the same top speed, 25 m/s. The red line reaches 25 m/s in 2 ½ seconds, while the green line does not reach 25 m/s until 5 seconds. The steeper the line is, the greater the rate of acceleration.
A velocity vs. time graph shows us how the velocity of a moving object changes with time.
Click on each line to see a description of the motion being illustrated.