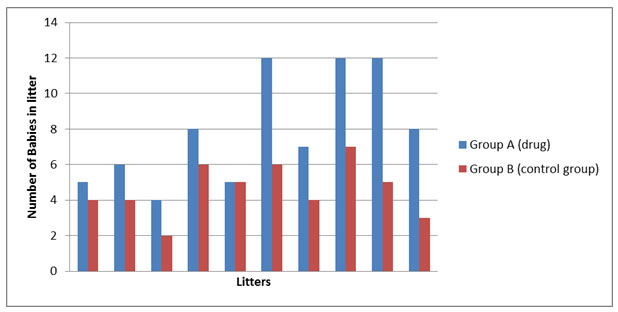
An experiment studies the effects of an experimental drug on the number of offspring a mother mouse has. Ten female mice are given the drug and then impregnated. The number of offspring in the litters produced by the mice that received the drug is compared to the number of offspring in the litters produced by the mice that did not receive the drug.
Which of the following is the best conclusion based on the data displayed in the graph?
A. The mice given the drug lived longer than the mice not given the drug.
Incorrect. Life span is not taken into account in this experiment.
B. It is better to give the mice the drug.
Incorrect. This is an opinion.
C. The mice given the drug on average produced more babies in each litter than the mice not given the drug.
Correct! This is a valid conclusion based on the data.
D. The drug seems to have no effect on the litter size.
Incorrect. Analyzing the data shows that the mice given the drug on average produced more babies in each litter than the mice that were not given the drug.
A student used a pH probe to determine the alkalinity of three unknown substances. She is asked to predict the pH of the fourth substance. She is told that sample D is more basic than sample A but less basic than sample C.
|
Sample |
pH |
|
A |
9.3 |
|
B |
6.9 |
|
C |
11.4 |
|
D |
|
Which of the following is a valid conclusion based on the information given?
A. Sample D is less than 6.9.
Incorrect. She is told that sample D is more basic than sample A but less basic than sample C. More than sample A means greater than 9.3.
B. Sample D is between 6.9 and 9.3.
Incorrect. She is told that sample D is more basic than sample A but less basic than sample C. More than sample A means greater than 9.3.
C. Sample D is between 9.3 and 11.4.
Correct! She is told that sample D is more basic than sample A but less basic than sample C. More than sample A, less than sample C means greater than 9.3 and less than 11.4.
D. Sample D is greater than 11.4.
Incorrect. She is told that sample D is more basic than sample A but less basic than sample C. Less than sample C means less than 11.4.
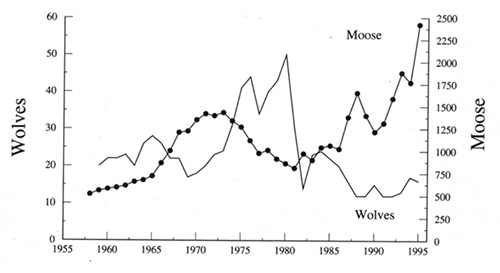
Which conclusion is best supported by the graph above?
A. There is a relationship between moose and wolf populations.
Incorrect. There is a relationship between the moose and wolf populations, but a valid conclusion should tell what the relationship is.
B. When the wolf population increases, the moose population decreases.
Correct! This is a valid, opinion free conclusion that is supported by the data.
C. The moose population doubled from 1960 to 1995.
Incorrect. This statement is not supported by the data.
D. The moose population was out of control in 1995.
Incorrect. This statement contains an opinion and therefore cannot be a valid conclusion.
Susan wants to know if vitamin drops decrease skin irritation and ulcers in her pet rats. She divides them into two equal groups, Group A and Group B. Group A is given 2.5 mL each of the liquid vitamins, while Group B is fed their normal diet without the vitamins. She counts the number of skin ulcers on the rats every day for four weeks and records them. Her data is shown in the table below.
Number of Skin Ulcers on Pet Rats
WEEK |
1 |
2 |
3 |
4 |
|
Group A |
26 |
23 |
19 |
17 |
|
Group B |
27 |
29 |
26 |
27 |
What conclusion can Susan draw from the data she collected?
A. There appears to be no connection between the vitamins and the number of skin ulcers on the rats.
Incorrect. Group A shows a steady decrease in the number of ulcers, and they took the vitamins.
B. The data are meaningless because Susan did not use a control group.
Incorrect. Susan’s control group is Group B, the rats who were fed their normal diet with no vitamins.
C. Rats that are fed twice the quantity of vitamins had half the number of sores after four weeks.
Incorrect. The experiment tests only if vitamins affect the number of skin ulcers, and did not test comparisons of different dosages.
D. The addition of vitamins to the diet of the rats decreases the skin ulcers.
Correct! Group A, given the vitamins, saw a decrease in the number of skin ulcers, while the control Group B did not.
The graph below shows the number of two species of mosquitoes, Anopheles Quadrimaculates and Aedes Aegypti, and the centimeters of rainfall per week.
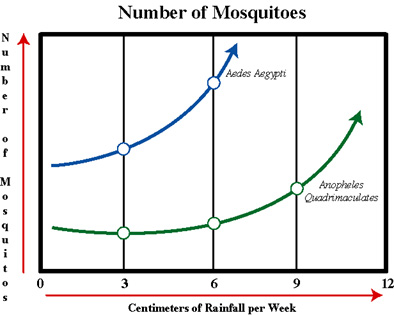
Which of the following conclusions can be drawn from the data in the graph?
A. The total number in each species is affected by the amount of rainfall.
Correct! Both species increase as the rainfall increases.
B. The number of mosquitoes is independent of the amount of rainfall.
Incorrect. The data indicates that the number of mosquitoes is affected by the amount of rainfall received.
C. Only the Anopheles mosquito is affected by the increase in rainfall.
Incorrect. Both species show an increase in the number of individual as rain increases.
D. High rainfall is caused by increasing numbers in the mosquito population.
Incorrect. The rainfall is the independent variable, and the number of individual mosquitoes is the dependent variable.