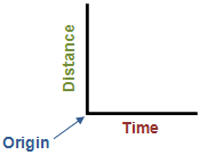
Distance is plotted on the Y-axis (side of the graph). The higher up the graph, the further the object is from the starting position.
The starting point of the object is not always 0 distance away from the reference point.
Time is always plotted on the X-axis (bottom of the graph). The further to the right on the axis, the more time has elapsed.
